star-tpc-l AT lists.bnl.gov
Subject: Star-tpc-l mailing list
List archive
Re: [[Star-tpc-l] ] peculiar behaviour in online cluster plot vs adc plots
- From: "Van Buren, Gene" <gene AT bnl.gov>
- To: "Videbaek, Flemming" <videbaek AT bnl.gov>
- Cc: Star-tpc L <Star-tpc-l AT lists.bnl.gov>
- Subject: Re: [[Star-tpc-l] ] peculiar behaviour in online cluster plot vs adc plots
- Date: Mon, 23 Jun 2025 05:24:29 +0000
Hi, Flemming
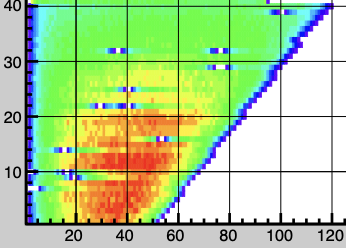
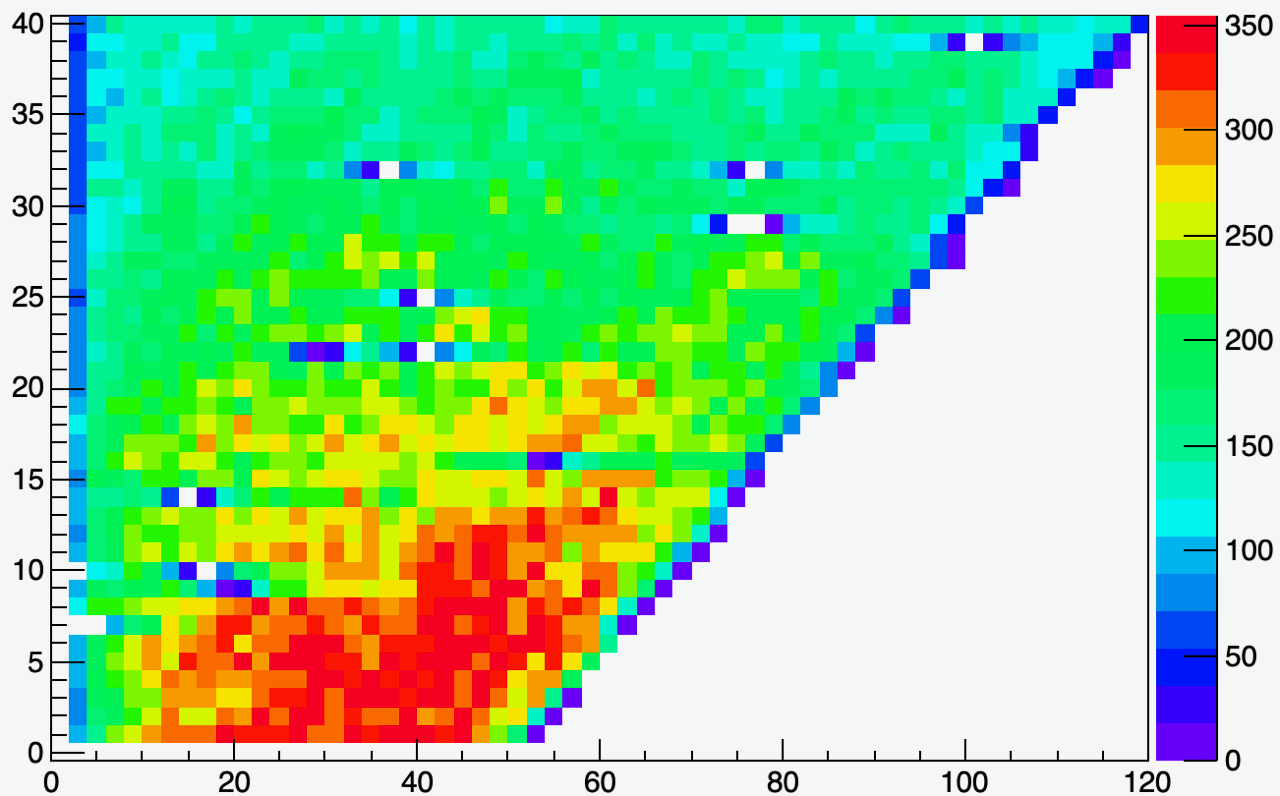
I took a look at run 173075, and the online QA plots for clusters do look like yours, with the highly different pad rows in sector 3 (see small attached plot). I looked at the clusters offline and that distribution looks similar to online QA. And then I looked at various other properties of the hits....
1) I thought maybe if there was a lot of low-pT tracks, we would see a larger average pads-per-cluster at small padrow (small radius), but I do NOT see that.
2) I found that near the dead spots, the flag==0 hits become the majority, while away from the dead spots, flag==2 are the majority. I have no idea if that is helpful.
I didn't spot anything else obvious. Thanks,
-Gene
> On Jun 22, 2025, at 12:45 PM, videbaek <videbaek AT bnl.gov> wrote:
>
>
> I took a recent run 173019
> The first plot is the adc distributions
> and the second the cluster. this is the itpc region. for itpc sector 3.
> You see that whenever there is a single dead channel is seems to affect regions in the same row
> by reduced intensity.
> Is this also seen in fastoffline? I guess whats shw there is hit distributions on track?
> This pattern is consistently seen over different sectors.
>
> I can understand there is reduced effenciency for clusters with the nominal cluster width in pads (3-5 pads) buts this seems to extend much further.
>
>
>
> --
> Flemming Videbaek
> senior scientist, emeritus
> videbaek @ bnl.gov
> Brookhaven National Lab
> Physics Department
> Bldg 510D
> Upton, NY 11973
>
> phone: 631-344-4106
> cell : 631-681-1596<Screenshot 2025-06-22 at 12.33.08.png><Screenshot 2025-06-22 at 12.32.45.png>
-
[[Star-tpc-l] ] peculiar behaviour in online cluster plot vs adc plots,
videbaek, 06/22/2025
- Re: [[Star-tpc-l] ] peculiar behaviour in online cluster plot vs adc plots, Van Buren, Gene, 06/23/2025
Archive powered by MHonArc 2.6.24.